Home

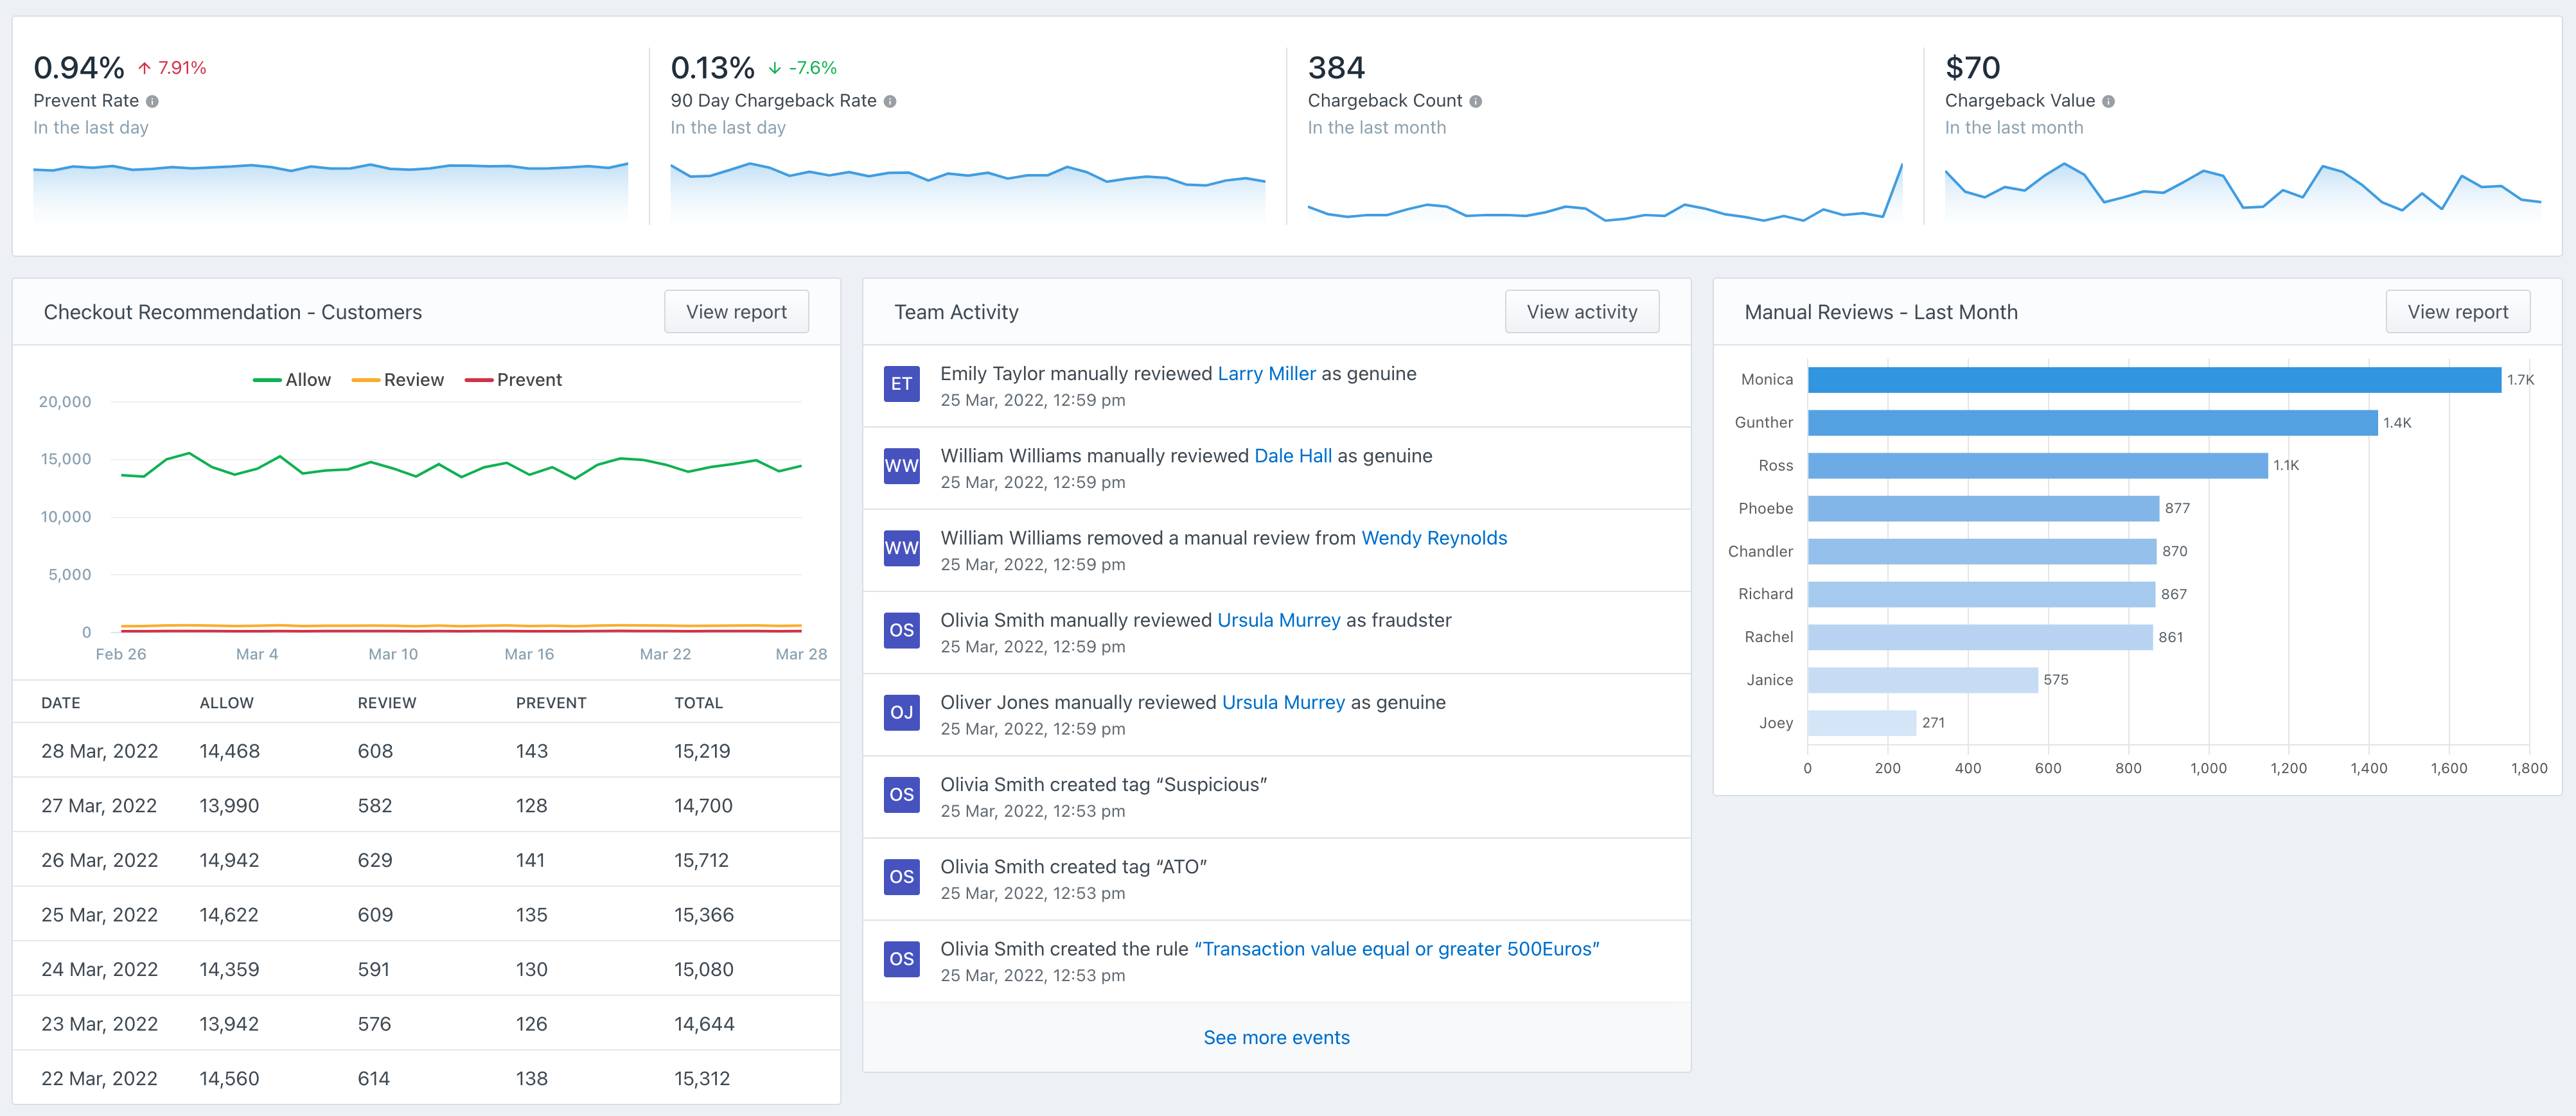
When you log in to the Ravelin dashboard, you're presented with the dashboard homepage, which provides a series of high level analytics to summarise recent performance.

https://ravelin.zendesk.com/hc/article_attachments/5087621213841/mceclip0.png

Overview Stats

There are four overview stats at the top of the page:

Manual Reviews

The Manual Reviews section gives you an overview of manual reviews made in the last month by your team.

The ‘View More’ option takes you to the Manual review metrics in Analytics.

Team activity

The Team Activity section provides an overview of recent actions carried out  by your team.

The ‘View More’ option takes you to the Team Activity page where you can see the full list.

Checkout Recommendation

This graph gives you an overview of how many customers Ravelin recommended that you prevent, review, or allow in a certain period of time. This will give you the first indication of any spikes or anomalies in your data.

Click the 'View more' button to view a list of metrics from the past 30 days.